Let’s talk about dashboards, shall we?
It’s not uncommon in my work to work on Monitoring or Observability problems.
A team or multiple teams deploy their applications in one of the environments, we can assume production, and they want to know how the System behaves.
The evolution I’ve seen is:
This is the first of a series of blog posts about Monitoring Dashboards; If you want to talk about this with me, you can find me on Twitter or LinkedIn.
At first, the team will install the provided Agent(s) in each component of the System (Applications, Platform, Cloud, OS, Mobile, etc), collect all possible metrics, and consume them using the default Dashboards provided by the Monitoring Software.
Then they expose custom metrics from the applications and create custom dashboards with the relevant metrics they want to track (throughput/error rates/latency/etc).
After some time, they realize they might need different types of dashboards depending on the context, this is what we are looking at in this series.
Dashboard Types
In time I identified at least three main types of dashboards
- Status dashboards
- Troubleshooting and Trends dashboards
- Alerting dashboards
Let’s look at them and see what it should be in each one of them and when you should use them.
Status Dashboards
Status dashboards, as the name would suggest, should show the current status of a system. The content should be intrinsically high level, something that everyone should be able to understand, something so simple that a new joiner should be able to read without the need for interpretations.
Status dashboards will mostly contain simple widgets like Stats or Gauges (or something more, as you will see at the end of the post).
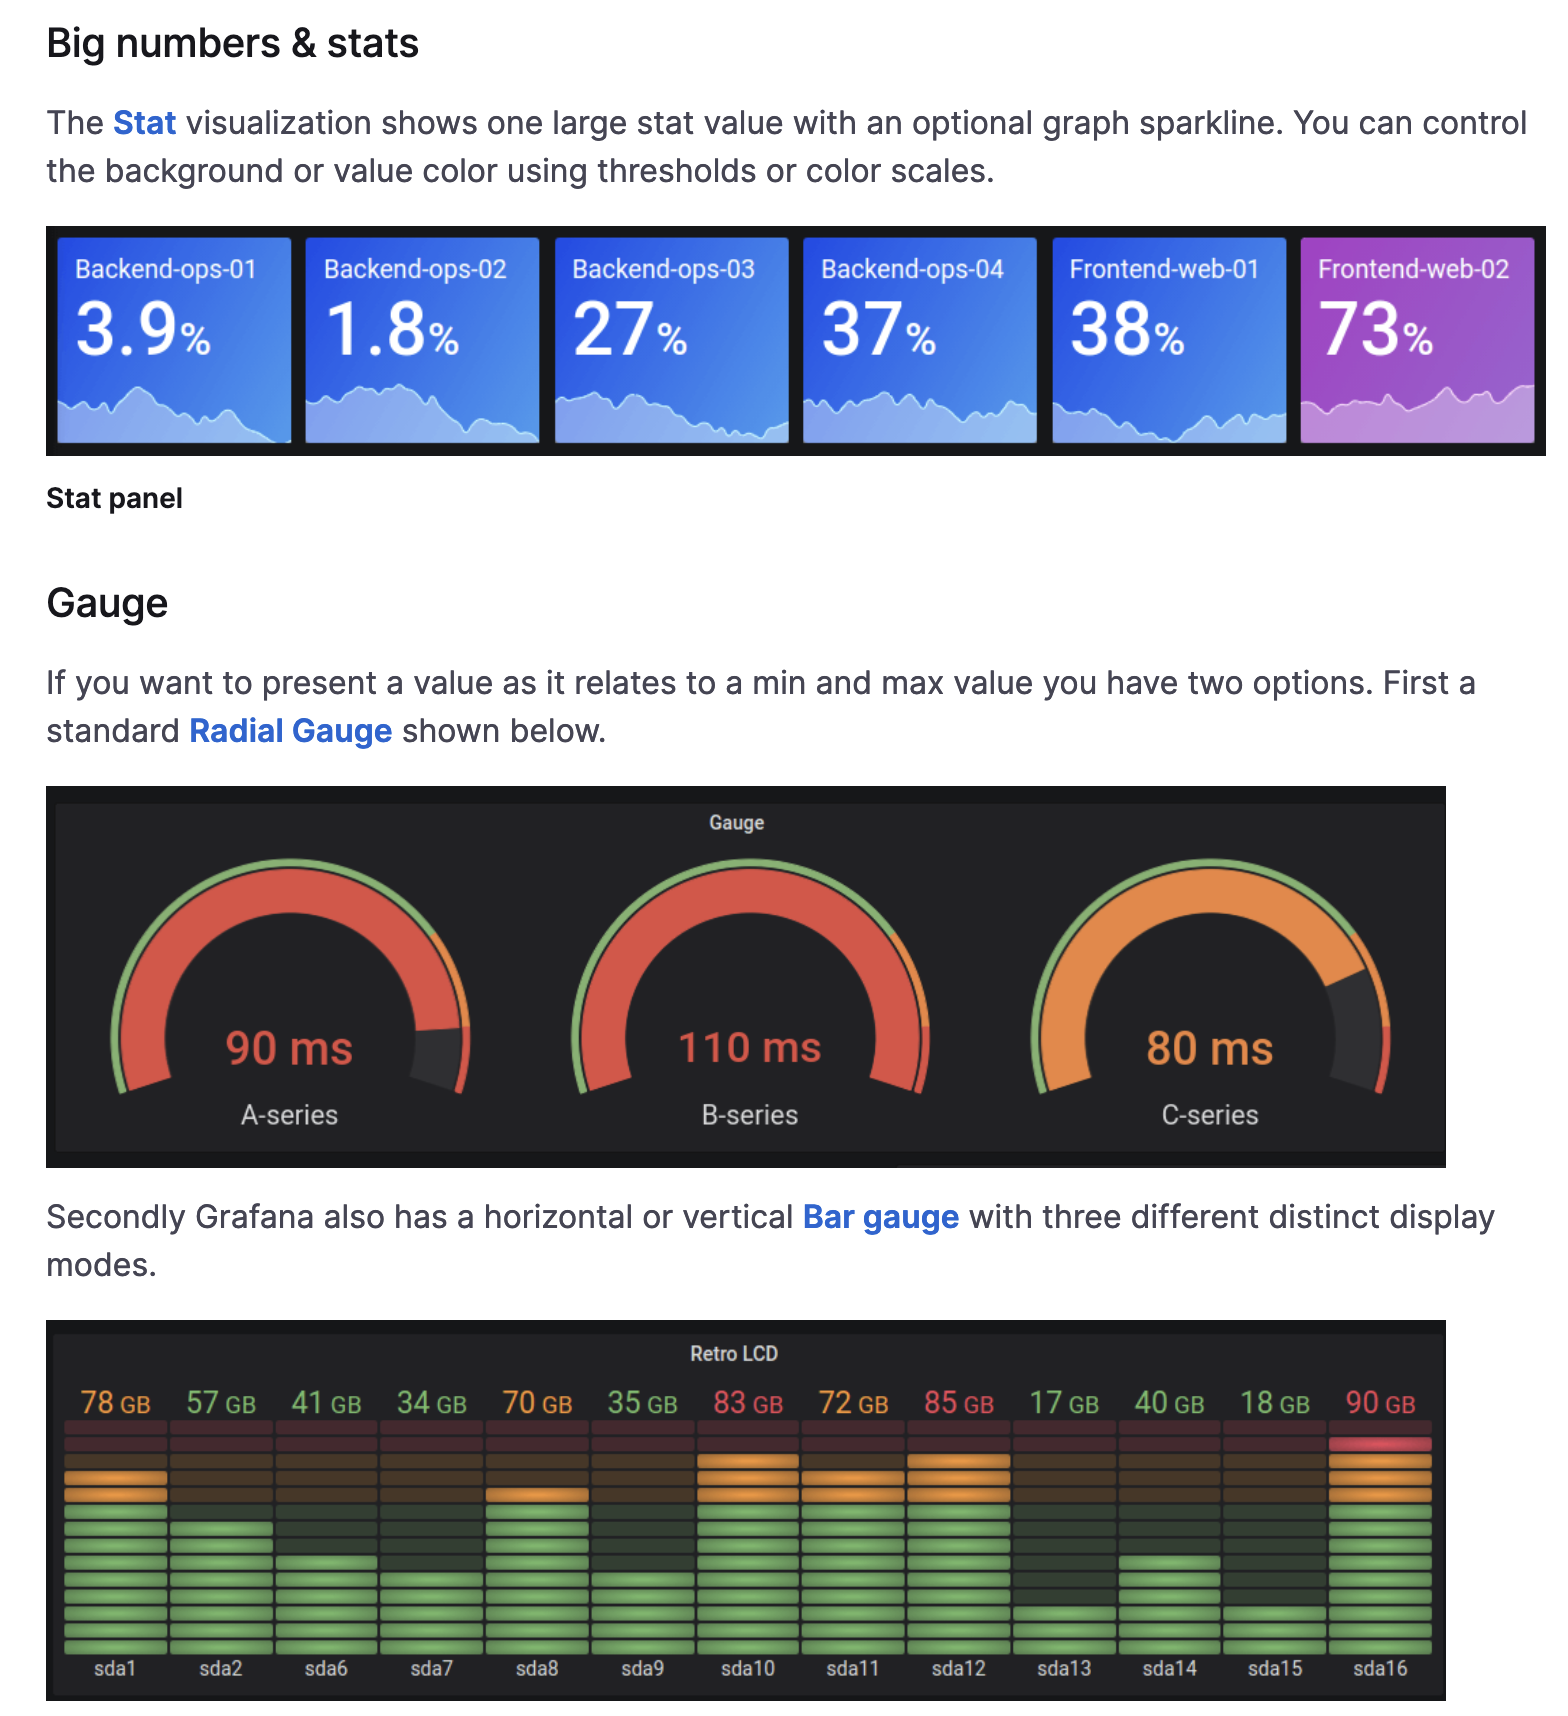
Metrics in the status pages should indicate the overall status of the system based on the KPI that you and the business consider necessary. Sometimes, if not most of the times, the default metrics are too low level to use in a Status Dashboard, and you’ll have to combine multiple metrics in a meaningful way.
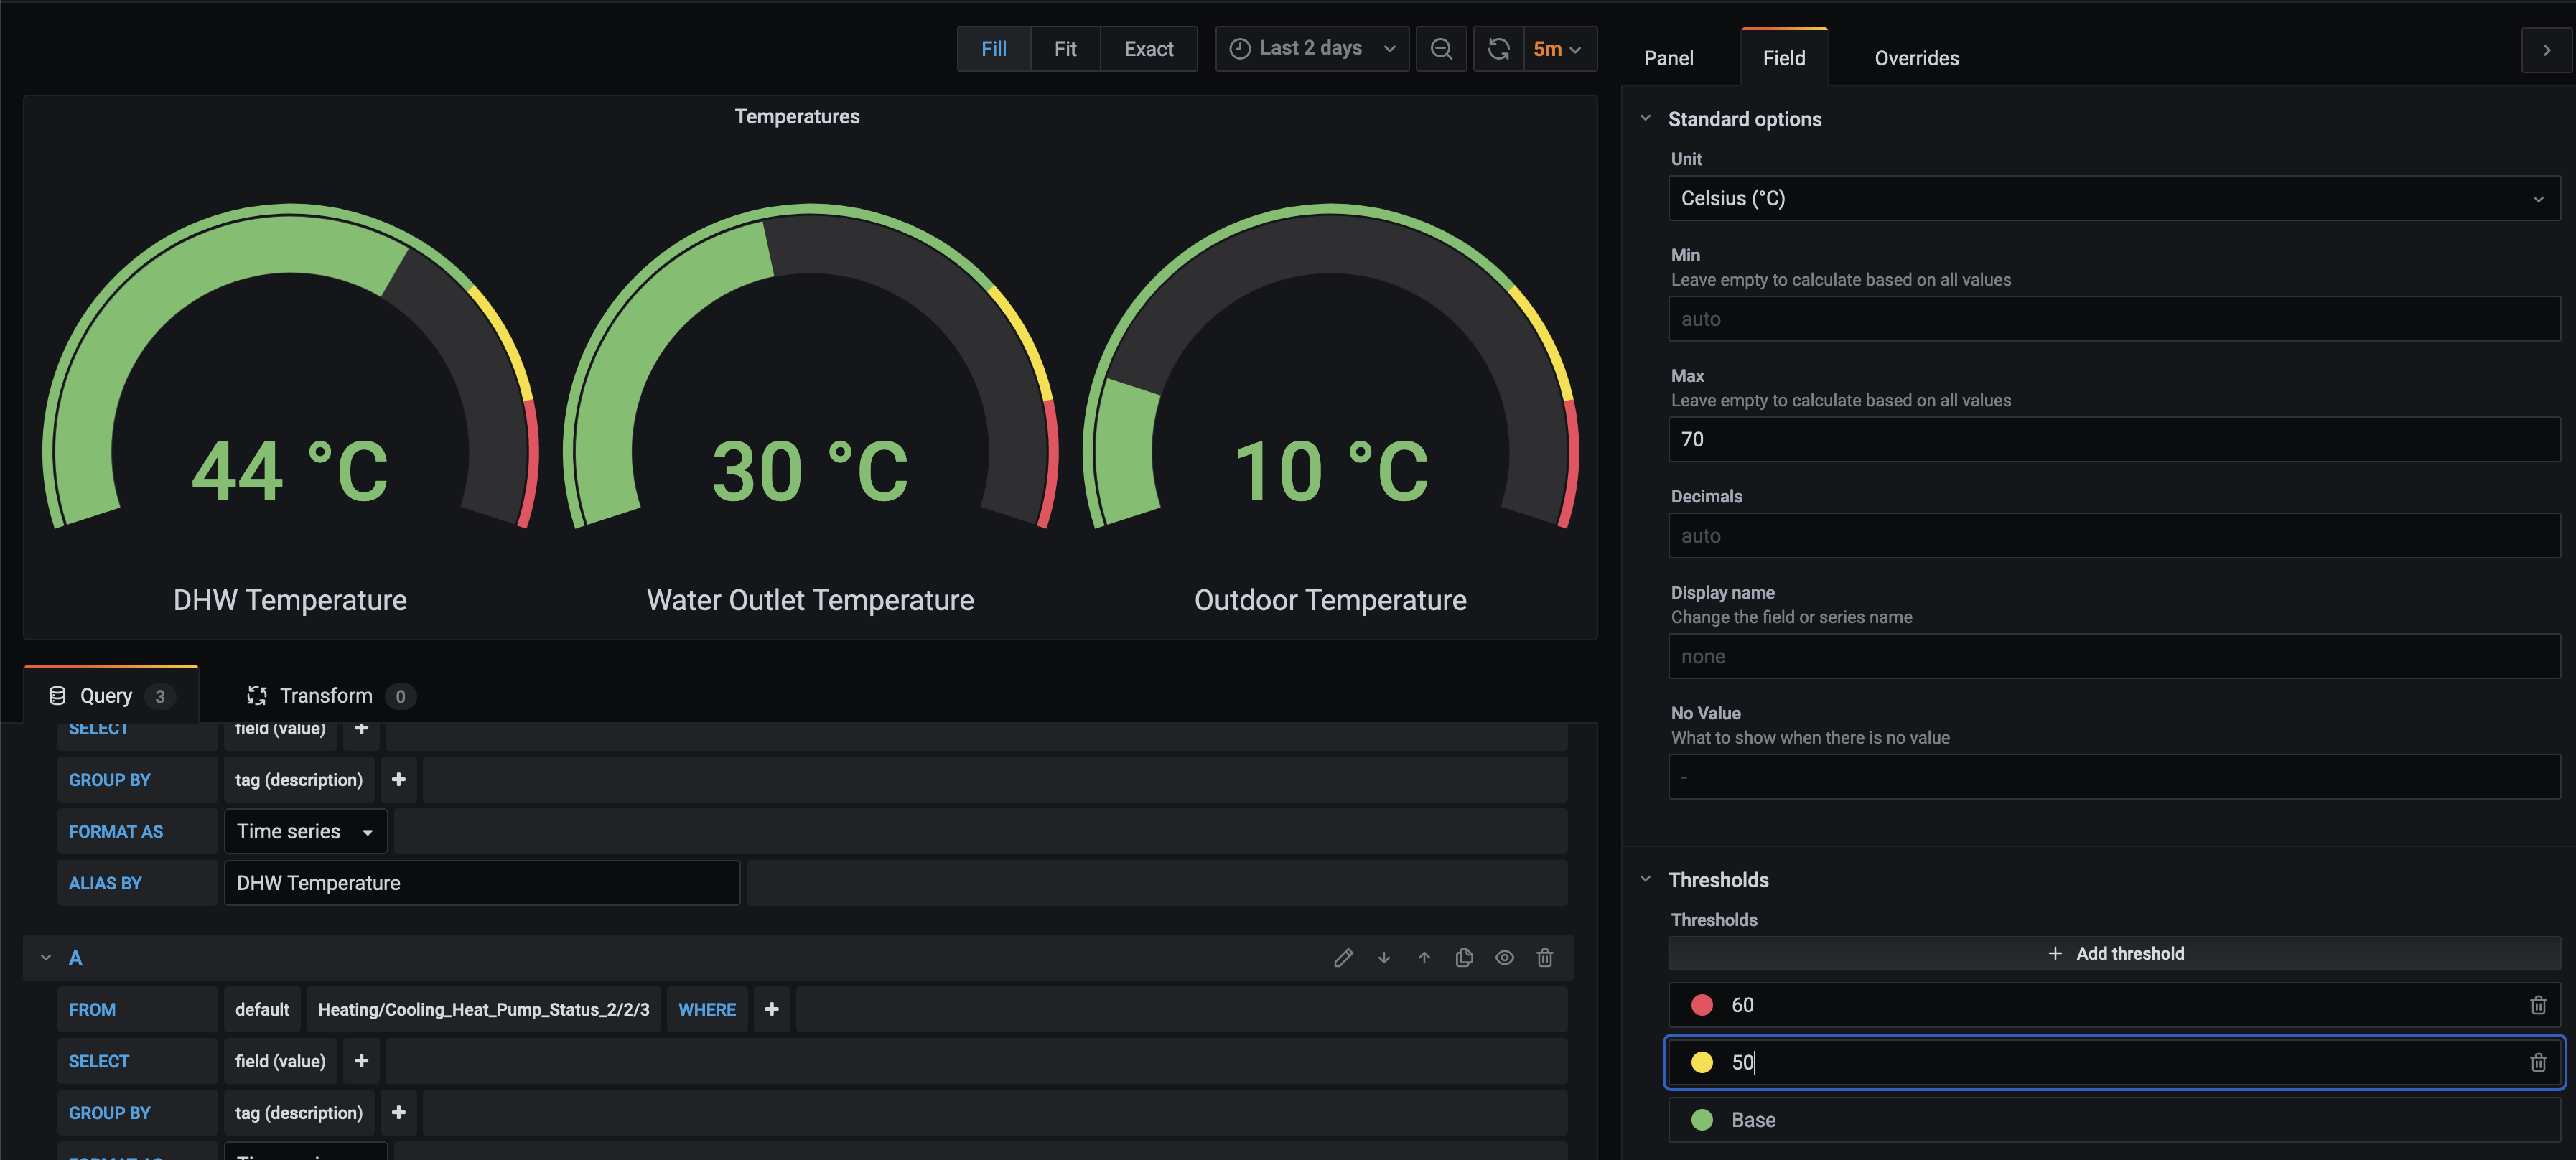
Also, the widgets above need tweaking to get the maximum out of them. Here is an example from my home automation dashboard where you can see two of the values (Max value and Thresholds) that you need to set:
Status dashboards are a snapshot in time; they will show you the latest read status of your System, and their values should be updated often.
Like everything else in your System, they will evolve in time, what is relevant today might not be tomorrow, and thresholds that seem ok today might be too small or too large tomorrow; thus, they should be treated as code and someone should be responsible for maintaining them up to date over time.
One last thing, we can assume that the same metrics used in Status Dashboards can be used for alerting almost without changes.
Did I forget something? Reach out on Twitter or LinkedIn and let’s talk about it.
Bonus
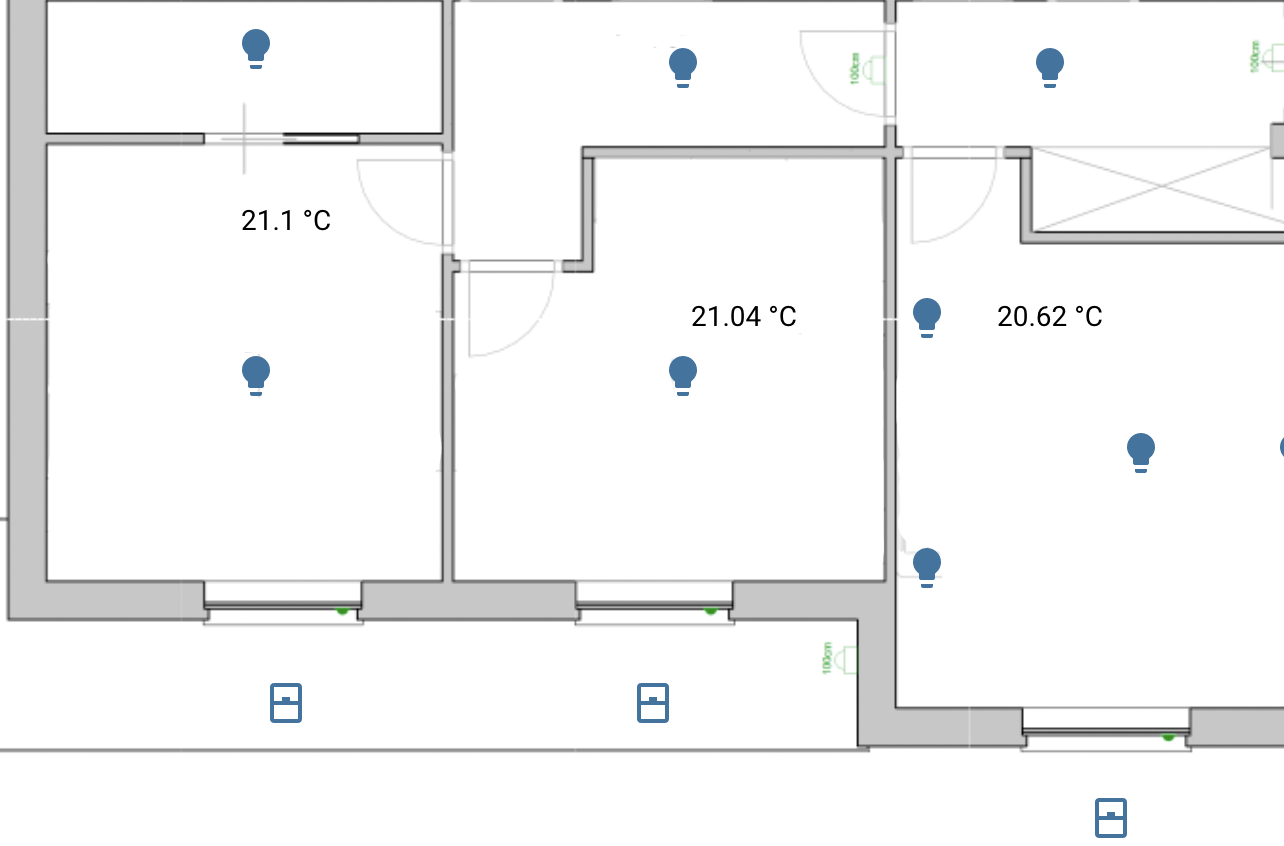
Status dashboards can go beyond standard widgets. Below is one section of my house; Status Dashboards should follow the “Don’t make me think” philosophy as much as possible, and what’s better than a clear picture to solve that?
How many “Types” of dashboards do you think your team needs? Share your thoughts with me on Twitter or LinkedIn